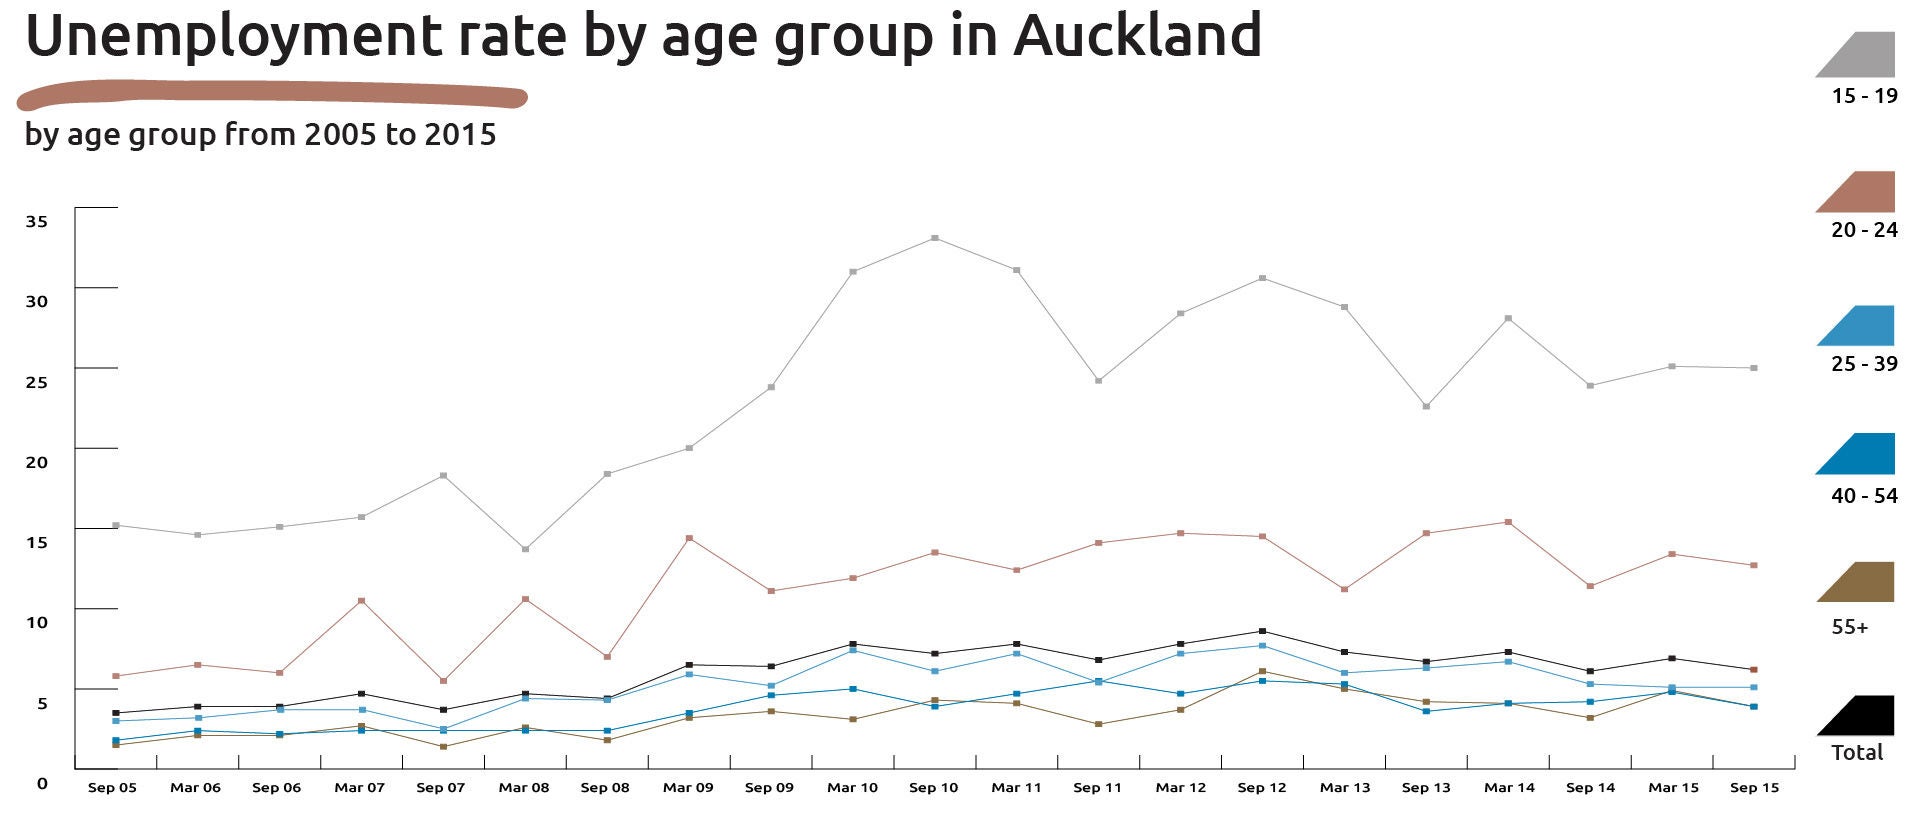
Source: Stats NZ, Household Labour Force Survey
In 2015, the employment situation for youth was beginning to improve from the peak of unemployment rates after the Global Financial Crisis, but these rates have not yet recovered as much as for other age groups.
Table 2: Auckland youth with the highest unemployment rates in 2013
Māori youth aged 20 to 24 | 23 per cent (compared with 15.2 per cent unemployment rate overall) |
Pacific youth aged 20 to 24 | 25 per cent (compared with 15.2 per cent unemployment rate overall) |
Note: Data on youth unemployment and NEET taken from a report into children and young people prepared by Auckland Council on the Knowledge Auckland website (PDF 2.9MB).
Auckland youth who are not in education, employment or training (NEET)
For young people, unemployment is only a part of their story. Young people aged 15 to 19 tend to be completing secondary school qualifications and beginning tertiary study or training. Those who are seeking work at this age are unlikely to have qualifications, skills or much work experience, contributing to these relatively high unemployment levels and low labour force participation rates (Auckland Council, 2017).
Therefore, to better understand young people's employment outcomes, data is collected on young people who are not in education, employment or training (NEET).
The NEET rate is designed to capture a wider understanding of the proportion of young people who are excluded and/or disengaged from both work and education, than standard measures for adults such as unemployment. Young people aged 15-24 who are NEET tend to take a longer time to find employment and have difficulty maintaining employment.
Table 3: Auckland youth with the highest not in education, employment or training (NEET) rates in 2015
Māori youth aged 20 to 24 | 26 per cent (compared to 13.4 per cent overall) |
Pacific youth aged 20 to 24 | 27 per cent (compared to 13.4 per cent overall) |
Data source: Stats NZ, Household Labour Force Survey.
Note: These figures need to be read with caution as there is a relatively high sampling error associated with estimating NEET rates by ethnicity and age, due to small sample sizes.
Notes
[1] In New Zealand, women experience more underemployment and unemployment than men. Women also earn less than men. There are a number of different factors that contribute to this including: historical discrimination, attitudes, biases and the amount of time that women have traditionally spent in unpaid caregiving work in the home. For more information on these factors see the
Ministry for Women, Gender Pay Gap website. Sourced 31/10/2017
[2] Statistics New Zealand defines underemployment in the Household Labour Force Survey as a person that worked part-time and would have liked to work more hours, and were available to do so. Statistics New Zealand states that there are different types of underemployment such as time-related, skill-related, and income-related inadequate employment and they face similar issues to unemployed people. Find more information see Introducing new measures of underemployment on the
Stats NZ website.
[3] Human Rights Commission,
Tracking Equality at Work, Sourced 02/11/2017. Data is from New Zealand Household Labour Force Survey, Statistics New Zealand (2015).
[4] The unemployment rate of young people in Auckland is higher than of other age groups, and has been for some time.
References
Auckland Council. (2017).
I Am Auckland - the Children and Young People's Strategic Action Plan.
Further reading
A report on young people not in education, employment or training on the
Scottish Government website.